1. Check your chart scale
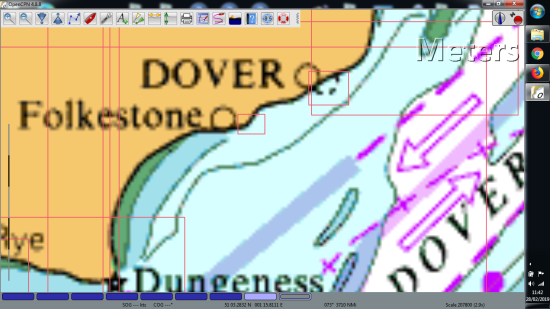
If a chart looks blurry or “blocky,” it’s often because a very small-scale chart is being viewed at too high a zoom level. In these cases, OpenCPN should instead be displaying a more detailed, larger-scale chart.
2. Adjust display settings
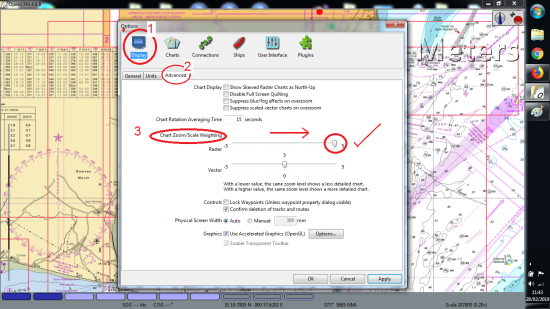
Go to Tools (spanner icon) → Display → Advanced
Move the top slider fully to the right (+5)
Ensure the checkbox for Use Accelerated Graphics (OpenGL) is ticked
These adjustments help larger-scale charts appear sooner when zooming in, while OpenGL smooths out the grainy effect.
3. Enjoy full detail
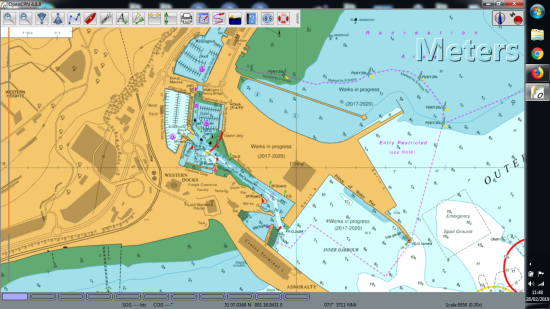
With these settings applied, your Unified Charts should display at their best — often right down to pontoon level — making navigation clearer and more precise.
This guide was first published on 28 February 2019